You don't need a PhD to understand simple math: three days plus 10 weights plus 330 competitors equals the greatest weekend of the year!
Previous NCAAs By The Numbers: 2025 | 2024 | 2023 | 2022 | 2021 | 2020 | 2019 | 2018 | 2017 | 2016 | 2015 | 2014
And with the 2026 edition of the NCAA D1 Wrestling Championships in our rear view, we can now slice and dice and analyze the results from this year's NCAA D1 Men's Wrestling Championships! You can find more information about the entire field that was clashing in Cleveland in our 2026 NCAA Men's Wrestling Championship Qualifiers By The Numbers article.
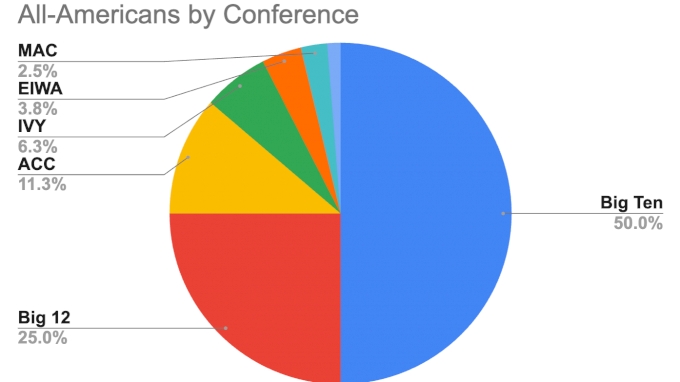
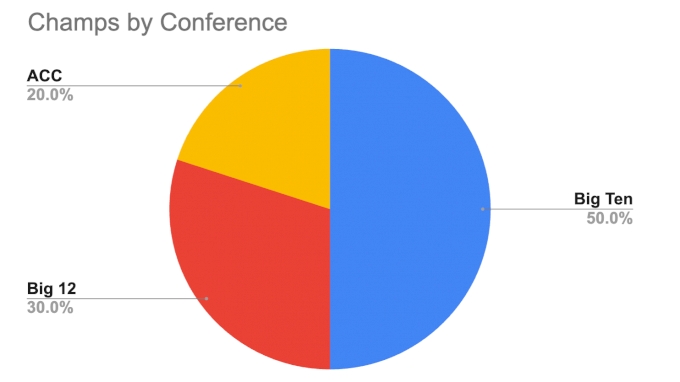
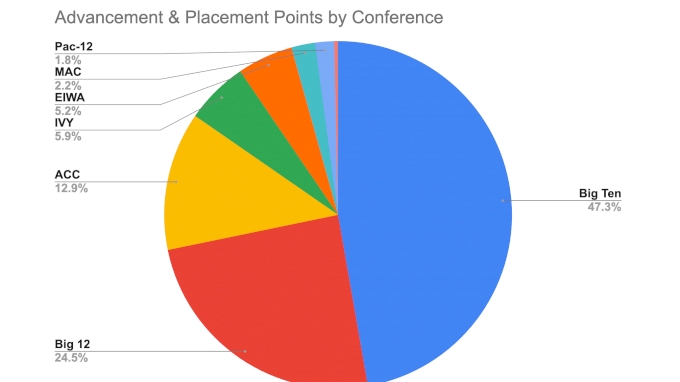
In news that will come as a shock to very few wise and learned wrestling fans, 2026 provides yet more evidence that the Big Ten is the deepest and toughest conference in the nation.
The Big Ten also has the most programs in its conference (tied with the Big 12), but they still produce enough All-Americans and champions to make it clear that they are still the deepest and toughest wrestling conference in the NCAA.
The table below shows the number of All-Americans per school in each conference in 2025. What may be most impressive is that the Big Ten earned half of all the All-American honors with less than one-third of the national qualifiers in the tournament.
| CONF | AAs | Schools | AAs/School |
|---|---|---|---|
| Big Ten | 40 | 14 | 2.9 |
| Big 12 | 20 | 14 | 1.4 |
| ACC | 9 | 7 | 1.3 |
| IVY | 5 | 6 | 0.8 |
| EIWA | 3 | 12 | 0.3 |
| Pac-12 | 1 | 4 | 0.3 |
| MAC | 2 | 12 | 0.2 |
As far back as I've been keeping track (so the year 2000), the Big Ten has always had a greater percentage of the All-Americans than national qualifiers at NCAAs, and this year was no different, as the B1G had 50% of the AAs but just 28% of the qualifiers. That spread of 22 percentage points is the largest difference between AAs and NQs since 2001, when the Big Ten had 46% of the AAs and just 22% of the qualifiers. The average difference between the two percentages from 2000 to 2026 (and excluding the canceled 2020 tournament) is 16%.
Besides breaking it down by conference, many wrestling fans are curious about the All-American counts by wrestlers' home states, so let's break it down like that now.
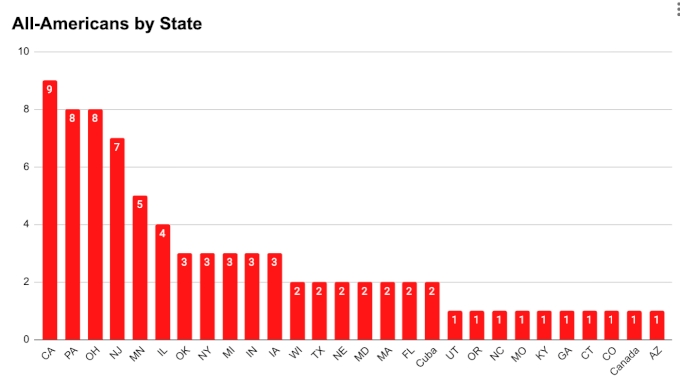
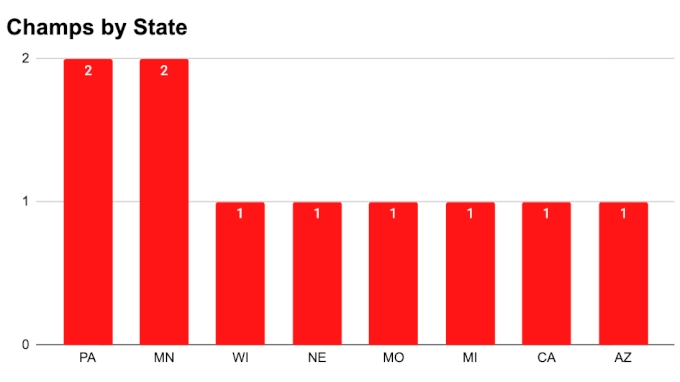
For the record, all home states are noted according to what the wrestlers have on their athlete bio pages. We're aware that Marc-Anthony McGowan spent his high school years in New Jersey, and that Jax Forrest and his family lived in North Carolina before moving to Pennsylvania, and that Anthonny Echemendia spent a year at Sunnyside High School after emigrating from Cuba before starting his college career. All of that is interesting and noteworthy, and we understand arguments can be made that those wrestlers should "count" for a state that is not listed in their bio pages.
We're still only going with the state in the bio page. Apologies to anyone who takes umbrage with that plan, because that's what we're doing!
Anyway, very impressive by California. That state has been waning lately. The lack of D1 programs in the Bear Republic doesn't help, and the shuttering of California Baptist's program will worsen the prospects of California high school wrestlers looking to make the jump to D1 athletics.
Despite that, California still recorded nine All-Americans, the most since I have been tracking such statistics (which is still since 2000). It's rare that Pennsylvania is not the number one home state for AAs, so kudos to the West Coast!
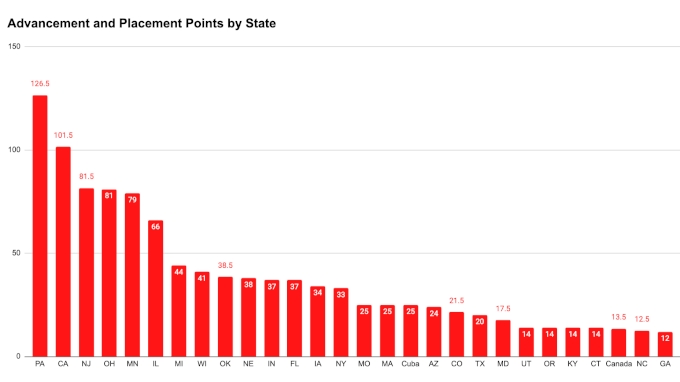
Besides just counting AAs, we can also add up the placement and advancement points earned by wrestlers' home states at the 2026 tournament. That tally puts the Keystone State back on top.
And then there's everyone's favorite per capita adjustment. Small states like Iowa, with just over three million inhabitants, typically do better by that metric. This year, however, it was Nebraska that shone brightest in the per capita measurement, helped in no small part by Antrell Taylor and Isaac Trumble, two finalists from the same high school in Omaha, Millard South. Very impressive stuff from Nebraska!
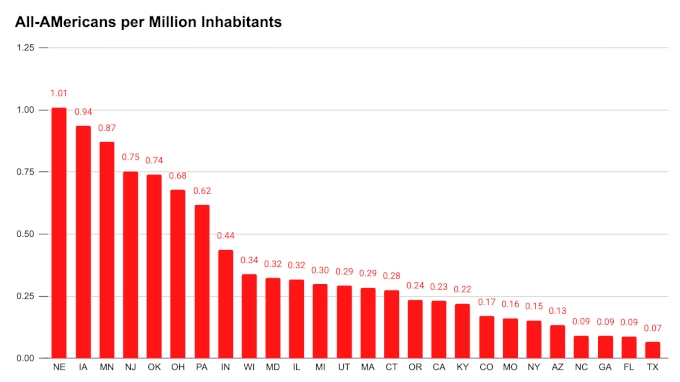
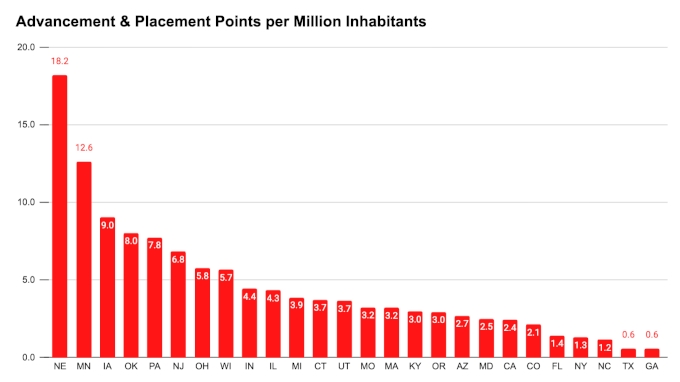
Nebraska and Minnesota both set records for most advancement and placement points in a single year (going back to 2000 anyway).
Another fun thing is to look at the feel-good stories emanating from Cleveland. The wrestlers that beat the odds and reached the podium despite having seeds or a national ranking that would suggest that would be an impossibility.
Top 10 Wrestlers Who Out-Placed Their Seeds
| WT | NAME | SCHOOL | SEED | NCAA PLACE |
|---|---|---|---|---|
| 197 | Gabe Arnold | Iowa | 27 | 7 |
| 149 | Chance Lamer | Nebraska | 20 | 4 |
| 184 | Zack Ryder | Oklahoma State | 22 | 8 |
| 141 | Carter Nogle | Air Force | 18 | 5 |
| 285 | Christian Carroll | Wyoming | 18 | 8 |
| 133 | Tyler Knox | Stanford | 15 | 6 |
| 149 | Aden Valencia | Stanford | 10 | 1 |
| 149 | Ryder Block | Iowa | 15 | 6 |
| 165 | Cesar Alvan | Columbia | 12 | 3 |
| 174 | Danny Wask | Navy | 15 | 6 |
Top 10 Wrestlers Who Out-Placed Their Rankings
| WT | NAME | SCHOOL | NCAA PLACE | RANK |
|---|---|---|---|---|
| 141 | Carter Nogle | Air Force | 5 | 28 |
| 197 | Gabe Arnold | Iowa | 7 | 29 |
| 141 | Wyatt Henson | Lock Haven | 8 | 27 |
| 184 | Caleb Campos | American | 4 | 21 |
| 149 | Chance Lamer | Nebraska | 4 | 20 |
| 125 | Tyler Klinsky | Rider | 8 | 22 |
| 149 | Ryder Block | Iowa | 6 | 18 |
| 165 | Cesar Alvan | Columbia | 3 | 15 |
| 125 | Marc-Anthony McGowan | Princeton | 2 | 13 |
| 174 | Danny Wask | Navy | 6 | 15 |
| 165 | Bryce Hepner | North Carolina | 7 | 16 |
You could write novels about the seasons had by everyone in the two tables above. They certainly captured a disproportionate amount of discussion at the NCAAs relative to other All-Americans.
Below is this year's Seed X Placement matrix.
| SEED-> | 1 | 2 | 3 | 4 | 5 | 6 | 7 | 8 |
|---|---|---|---|---|---|---|---|---|
| 1 | 5 | 4 | 1 | |||||
| 2 | 2 | 2 | 1 | 1 | ||||
| 3 | 1 | 2 | 2 | 2 | 1 | 1 | ||
| 4 | 1 | 2 | 1 | 2 | ||||
| 5 | 1 | 2 | 1 | 2 | ||||
| 6 | 1 | 2 | ||||||
| 7 | 1 | 1 | 1 | 2 | 1 | 1 | ||
| 8 | 1 | 1 | 1 | |||||
| 9 | 1 | 2 | ||||||
| 10 | 1 | 1 | 1 | 1 | ||||
| 11 | 1 | 1 | 1 | 1 | 2 | |||
| 12 | 1 | 1 | ||||||
| 13 | 1 | 1 | 1 | |||||
| 14 | 1 | |||||||
| 15 | 3 | 1 | ||||||
| 16 | 2 | |||||||
| 18 | 1 | 1 | ||||||
| 20 | 1 | |||||||
| 22 | 1 | |||||||
| 27 | 1 |
Only six #2 seeds made the podium. That's crazy. The fewest #2 seeds since 2000 before last weekend is eight. 2026 was a bad year to be a #2 seed.
The ying to the 2 seed's yang this season was the #11 seeds. Six #11 seeds earned All-American honors. That's the same number of AAs for both the #2 and #11 seeds!
In 2014 also saw six #11 seeds climb the podium steps. That's still nuts, though. Precisely ZERO #11 seeds earned AA honors in 2017.
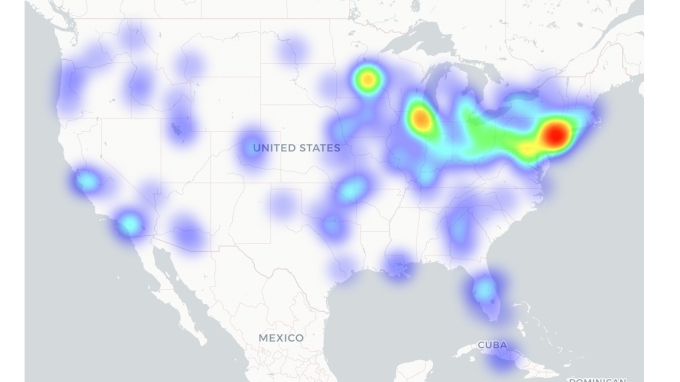
Truly a mind-boggling tournament. Okay, time to close things out with our annual show stopper, the heat map! This year we have two varieties: Classic and Circle.
Here's the classic heat map, with the location derived from the wrestlers' hometowns and the intensity determined by advancement and placement points.
And here's the new circle version.
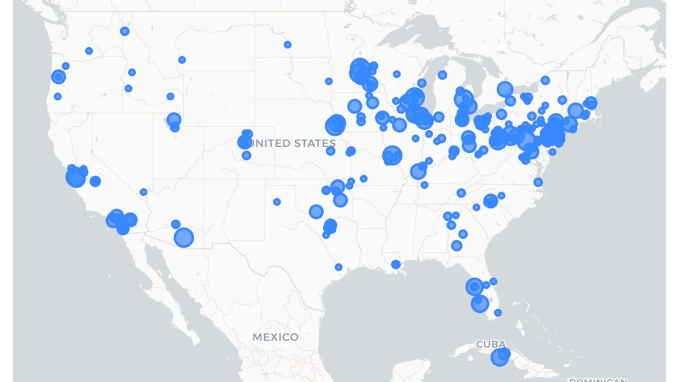
The traditional hotbeds continue to thrive but the south is gaining ground. North Carolina, Georgia and Florida all had solid tournaments.
We'll have more facts and figures and whatnot as we continue to parse the data, but that's all for now. Fantastic NCAAs, no? I hope you all enjoyed!